
What do Q and S mean on the RNode interface ?
Started by Tukan 8dab5fc052de8a96... ·
I could not find this information.
Can anyone tell me what the Q and S bars in the lower part of the screen mean on the RNode interface please ?
And where did you find the information ?
Thanks,
Tukan
Since raw signal strength is not a very good indicator on LoRa (usable signals can be well below the noise floor), RNode displays both signal (S)trength and signal (Q)uality. That's what they are. You can have very low RSSI (strength), but still totally decent quality.
Ho great ! Thank you :D
That's already great to know.
But now I am intrigued : Strength and Quality in relation to what ?
I mean, if I only have 2 RNodes, then I guess it's pretty simple, it's in relation to the other RNode.
But in case where there are more than 2 RNodes ? Is that the strength and quality in relation to a specific RNode (maybe the strongest signal) ? Or is it an average ? Or something else ?
Tukan wrote:
But now I am intrigued : Strength and Quality in relation to what ?
No, there is no "in relation". There are two measurable quantities, RSSI and SNR.
RSSI (received signal strength indicator) is an internal measurement, taken by the LoRa baseband chip, represented in -dBm units (or decibels, compared to 1mW of power over 50 ohms, an ABSOLUTE level). For example the SX1262 LoRa baseband we all widely use for RNodes, has sensitivity between -117dBm (poorest) and -148dBm(best), depending on LoRa modes and settings, which means, any RSSI level ABOVE (toward 0) those, will actually get you the data, that was sent. So the Strenght indication on a node should be tied to it's real HW - what LoRa baseband you have, and how much loss or amplification you have between air and the CONCRETE baseband chip, including antenna, cable loss, filter loss, LNA (low noise amplifier, used for receive) amplification, etc. So you see, it's just a VERY ROUGH indicator.
SNR or Signal to Noise Ratio is THE USEFUL indication of what is going on, because, as Mark pointed out, LoRa baseband chips a pretty sensitive and many nodes have LNA's on the input. It is given in dB BECAUSE IT'S A RELATION. It will tell you what is the relation, between the useful signal's level IN RELATION TO THE NOISE LEVEL in the received signal. Of course you design and deploy any radio system in such a way, as to MAXIMIZE the SNR, meaning having more USEFUL signal and less crap. This crap, which we generally call noise, is a lot of things. From external noise, such as space noise, other RF signals, switching power supply noises, all kinds of unfiltered crap, trough our own power supply's noise, the CPU and display in your node, the inherent internal noise level of your own LNA, in the end to the internal noise levels of the LoRa baseband chip itself. So the HIGHER SNR, the better! And it is, as reported by the baseband, represented as QUALITY indication.
Two example measurements from a run I did recently:

This one worked flawlessly! The SNR level shows, that the useful signal has 12.6 times more power, than the noise (11dB).

This one, albeit having an RSSI WELL WITHIN the sensitivity range of an E22 LoRa module, took multiple retries and BARELY got a single letter to and back from my EchoBot. The SNR shows, that the signal has 1.5 times the power of the whole noise floor, they are very close, and the receiver can BARELY distinguish the useful signal from the swamp.
And because most people would rather not learn and understand, but just USE AS IS - you have graphs with bars and a single letter, instead of dBm values, which would tell you much more, if you bothere to grasp. ;) ALL THIS information is out there online, and there are a million good videos on LoRa and SNR and RSSI and all of it.
A bit more on the topic with a nice graph from the web:
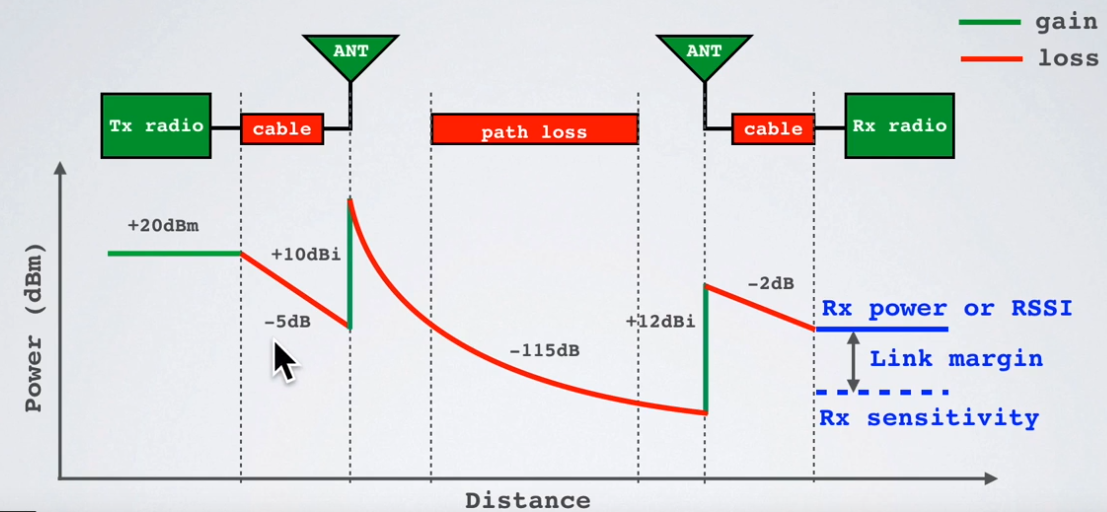
Here you have the whole RF link depicted, one way. You have a 20dBm or 100mW (20dB over 1mW, remember?) power output capable transmitter. You feed this power to the antenna, trough a coaxial cable, that has around 5dB of loss for your frequency, leading to 15dBm or 32mW reaching the antenna, as you have lost 68mW in the cable. As this is 68% i never stop urging people to use good cables, connectors and common sense, when deciding to use a 100mW node trough 10 meters of coax cable... Now, the antenna is resonant and has actual gain within the frequency range of interest. No, IT DOES NOT AMPLIFY, it just focuses energy in certain areas, just like a magnifying glass does not AMPLIFY sun's energy, it just places it all onto a tiny area, actually increasing POWER DENSITY. So this antenna is presumably DIRECTIONAL, with 10dB of gain, which would give us an equivalent 10-fold increase in power over the focus area, that will take us from 32mW to 320mW EIRP or Effective Radiated Power. Good! Now we have the air, we have water, particles, losses, reflections, it is a messy chaos for a radio signal, and in the end, when we reach the receiver, we have lost so much signal power, that we are at -115dB below the transmit antenna level, or... -90dBm! This a TINNYYY amount of power with so many zeroes in front of it, I have no intent on trying to write down. Now, our receive antenna is EVEN BETTER, having 15dB of gain, or almost 32 times the power, bringing us up to -78dBm of signal level, still crazy small, but well into the sensitivity range of the receivers we all use. KEEP IN MIND I don't talk about SNR here! Just COMPLETE signal levels, with noise and all, whatever is on the frequency. Again, we lose 2dB, or 1.6 times the power in the freakin cable, until we get to the -80dBm of a signal, we can give to our receiver.
If you take all the losses in the link, air, cable, whatever else, and compare it with what is your receiver's sensitivity and capacity to distinguish signal from noise, you will arrive at you LINK BUDGET, a number which will tell you if this link is even possible, or you need more power, better antennas, less losses, better antenna placement, etc. Or just nothing would help...
@aetherlab I'm sorry you had to go into so much details to remind the bases of radio. But thanks anyway.
My question is simply about how to interpret the graphs shown in the bars :
Is it showing the link quality with a specific node ?
Is it an average of all the nodes links that are in range, including the ones with a poor signal ?
Basically I want to know when I see the graphs showing a good quality link, does that mean that all the nodes in range have a good quality link ? Or does it mean that there is one good quality link with at least one of the nodes around but maybe there is a terrible link quality with a node that is far away and this is not showing in the graph ?
The answer will be related to the nature of radio waves for sure, but also the choices made to display the graphs.
Tukan wrote:
@aetherlab I'm sorry you had to go into so much details to remind the bases of radio. But thanks anyway.
No, why sorry? I am a radio engineer and I love to explain and share my knowledge.
Your indicators show only YOUR receiver's internal reports for RSSI (strength) and SNR (quality). This is on YOUR end. It does not evaluate the link in general, or it's signal budget. It just tells you how good you fare on your frequency, it does not know about other nodes and what is your relation to them. It is a POV measurement. I hope soon we will all have a tool for doing this and actually map coverage automatically, but this is work in progress, that others do now.
So how to interpret? Well, S is not that useful, as it encompasses all - noise and signals. Q is meaningful, and the higher, the better, as it shows you SNR. If you have good SNR or high link Quality, that S is not an issue - it is enough.