RNS Logo

rns.recipes

◈ 9ce92808be498e9e05590ff27cbfdfe4
Upcoming RNS 1.6.0 https://rns.recipes/forum/general/upcoming-rns-160-help-testing

RNS 1.6.0 Released

Started by Mark bc7291552be7a58f... ·

Mark 8dd57a7382268096...
#1

This major release of Reticulum brings significant improvements to resource consumption, performance, stability and resilience, especially for constrained devices and nodes.


Memory & Performance Improvements


A new, SQLite based storage backend has been implemented, and is now the default. All legacy file-based storage will be auto-migrated to the database-backed store on the first start. If you are using an esoteric system that does not support the sqlite3 module, Reticulum will automatically fall back to using the file-based storage system.


The memory management system has been completely reworked, and significantly improved. For long-running transport nodes, this cuts memory consumption by approximately 50%, and for non-transport instances, standalone applications and appliance devices by up to 80%.


Path Table Sharding


This release implements the initial transport awareness and mechanisms for emergent path table sharding. Transport instances will no longer attempt to hold full inter-network path tables in memory, but keep only paths relevant to the nodes they are transporting traffic for. Unused paths are now kept for much shorter periods of time, and used as a rolling pool that potential new traffic corridors can form into. The system is entirely passive, and adds no inter-node coordination or additional protocol mechanics. The current release brings the foundation, and the upcoming 1.6.x releases will tune, improve it and add the remaining pieces of the functionality.


Network Stamps


The stamp system, first introduced in LXMF, where it was tested and refined over the last two years, has now been brought into the core of Reticulum to help protect against spam and network abuse. All the relevant core primtives now support stamp generation and verification:


  • Identities can be created with an embedded stamp value. This adds no additional bytes or identity format changes. Generation and verification is completely transparent, and carried within the Reticulum Identity keyset.
  • Destinations can now be stamped, and will embed stamps and required link request cost in their announces. The change is backwards-compatible, so even older versions of Reticulum carry stamped announces transparently. Destination stamps are one-time generations, stored and persisted on success, so these have relatively high default target values. Expect some CPU usage when an unstamped destination has its stamp generated for the first time on 1.6.0+.
  • Path requests can now be stamped, and are also backwards-compatible. A stamped path request will be carried transparently by non stamp-aware transport nodes.
  • Link requests are stamped according to the announced link request cost of the destination. As with all the other primitives, these are also completely transparent and backwards-compatible. The stamp is carried embedded in the ephemeral link request keyset.


The stamp functionality and requirements will be deployed in a phased transition, so both network operators and application developers have time to update their systems, and any potential bugs and issues can be worked out before the full deployment:


  • Version 1.6.0 implements all the core functionality and primitives, and starts excercising the verification mechanics. By default, no destination and path request stamps are generated yet in this release, and while stamps are checked and verified, they are not enforced. However, both stamp emission and enforcement can be enabled in the configuration for testing or early opt-in. Link request stamps will be generated, if the destination has announced a cost.
  • Version 1.6.1 will enable stamp emission for all network primitives by default. Old, unstamped destinations will have their stamps generated automatically on their first announce, and will start announcing link request costs as configured. Enforcement in this phase will still be disabled by default, but can be enabled by configuration.
  • Version 1.6.2 will complete the transition to network stamps. All functionality will now be enabled by default, including enforcement. Destination announces, path requests and link requests that do not meet stamp requirements will be dropped. Any old transport nodes that have not updated to 1.6.x will not be able to communicate with stamp-enforcing nodes, but will still carry traffic for stamp-capable systems.


The 1.6.0 and 1.6.1 releases will be an important time for observing the on-network behaviour, functionality and stability of the system, and to make any potential adjustments or fix problems before the final transition to 1.6.2. If you're operating a transport node, please help out by reporting any problems or issues you discover.


For application developers, there is no immediate refactoring or changes required application-side. Simply updating RNS to 1.6.0 is sufficient to transparently enable all the new functionality and improvements. It is very much recommended, however, to familiarize yourself with the new API methods for specifying link request costs and destination values, as these are configurable on a per-destination basis, and might warrant specific configuration for your intended use-case.


Changes

  • Added Identity stamps
  • Added destination and announce stamps
  • Added path request stamps
  • Added link request stamps
  • Added link request cost signalling to announces
  • Added fractional stamp value support
  • Added path usage tracking
  • Added automatic path table culling based on traffic and usage
  • Added path retainment prioritization for slow interfaces
  • Added unused path pool monitoring and handling
  • Added managed storage backend using SQLite
  • Added fallback to legacy file-based storage if SQLite is unavailable
  • Added managed storage for known destinations and ratchets
  • Added managed storage for cached announces
  • Added memory-density optimized announce rate table implementation
  • Added memory-density optimized packet hashlist implementation
  • Added heap-tracking memory management
  • Added more comprehensive metrics to status output structure
  • Added improved filtering backend capabilities
  • Added new [filter] configuration section
  • Added hop_limiter configuration option
  • Added allow and ignore lists for destination types
  • Added ability for applications to receive required announces only
  • Added cost-aware interface discovery and auto-connects
  • Added cost and value display to rnstatus and rnpath utilities
  • Added app_flag signalling to resource advertisements
  • Added link MTU aware resource advertisements
  • Significantly improved inbound announce handling performance
  • Significantly improved stamper performance on Android
  • Significantly improved announce handler callback performance
  • Optimized and improved stamper implementation
  • Optimized announce rate table handling
  • Optimized packet filter hashlist handling
  • Improved early filtering and malformed packet detection
  • Improved path request protocol violation handling
  • Fixed RNodeInterface phy stats regression on Android
  • Fixed missing interface parameter inheritances
  • Fixed rngit default config path typo for ~/.config/rngit case
  • Fixed invalid RPC error handling in some cases
  • Fixed various minor bugs and inconsistencies
  • Updated documentation
Mark 8dd57a7382268096...
#2

Thanks to everyone who helped testing this along the way <3


If you find anything weird or wonky in this release, or have questions about how all of the new stuff works, post it here!

Rudi Mentaire 65e0ce50386e9c4e...
#3

At first: Congratulations!


While reading the remarks, one question came into my mind: when stamps tied to identities can't be changed or updated, does this imply that any identity will get rejected at some point in the future (because the stamp will be relatively small then) and people will have to throw away any identity sooner or later (depending on what they are used for)?

K8 a361065d039738f6...
edited #4

Awesome work! I just got this deployed on rns.kin.earth, seems fine so far. I didn't blow away my previous storage/ and the migration seems to have worked with no snags. Previously my memory usage would shoot up to 300+MB not long after startup, but with 1.6.0 it seems to be staying around 100MB so far, nice! dances


If you're ready to take some fresh new requests after all that work... :P


It would be nice if stamp generation kept one core free to keep the node responsive. Whether that's the default or not, it would be great if the number of worker processes was user-configurable.


Can interface discovery stamps be persisted? I had a patch to do that on my node so that the stamp_cache survived restarts, which made doing maintenance that required a lot of restarts a lot more pleasant, but it would need to be ported to the new sqlite backend. I didn't get around to doing it, but I was also planning on including last_discovery_announce in what was persisted so that the announces would stay on their proper cadence and not get spammed from frequent restarts.

Mark 8dd57a7382268096...
#5

Thanks @K8, good to hear! Those are some good suggestions. I'll get refinements like that added in 1.6.1.


@Rudi, the identity stamps are sort of a bonus feature for now, not really used actively on normal identities as such, but will probably become relevant at some point in the future. Where it is used right now is in the link establishment process. Since every link request is created from a new, ephemeral identity (to keep the link initiator anonymous), this is an obvious and elegant place to put the stamp, since there's zero extra packet overhead, and the destination can easily verify the stamp value of the link request; it's embedded in the link request identity!


It's also a very useful feature for future applications, where you want to make "throaway identities" posting spam, sockpuppet accounts, et cetera, et cetera, something that is expensive and not very feasible, for example on self-publishing systems, discussions, and so on.


Current clients will probably continue to use the existing verification mechanisms (along with the now added, network-level stamps), but it's a nice additional tool to also have when building new protocols and applications.

K8 a361065d039738f6...
#6

Well, the good times didn't last. ~24hr later the node was back using 600MB of memory, churning around 700 threads, and becoming unresponsive while maxing out a CPU core. I wiped out most of the node's storage this time around, we'll see if that helps at all. It's extra weird because my discovery stamp value is no longer in the top 3, so out of the default autoconnect range, and my client count is way down.

Mark 8dd57a7382268096...
#7

Hmm, that's quite interesting @K8. Something fishy is going on there. Some questions off the top of my head to see if we can try and get to the bottom of it:


  • Is it using plain, vanilla RNS 1.6.0, or do you have any custom patches?
  • Is the profiler or custom logging active?
  • What kind of interfaces is it running? Actually, could you maybe send me the config file, so I can see exactly how it's set up?
  • If you want to, send me an rngit client identity for allowing, and I can give you access to some monitoring tools I'm working on, might make it easier to see what's going on if things are logged over time.


There's definitely something weird happening there, and I'd love to know what it is, since on all the nodes I've tested this on so far, nothing of the sort happens.

Mark Moderator 8dd57a7382268096...
#8

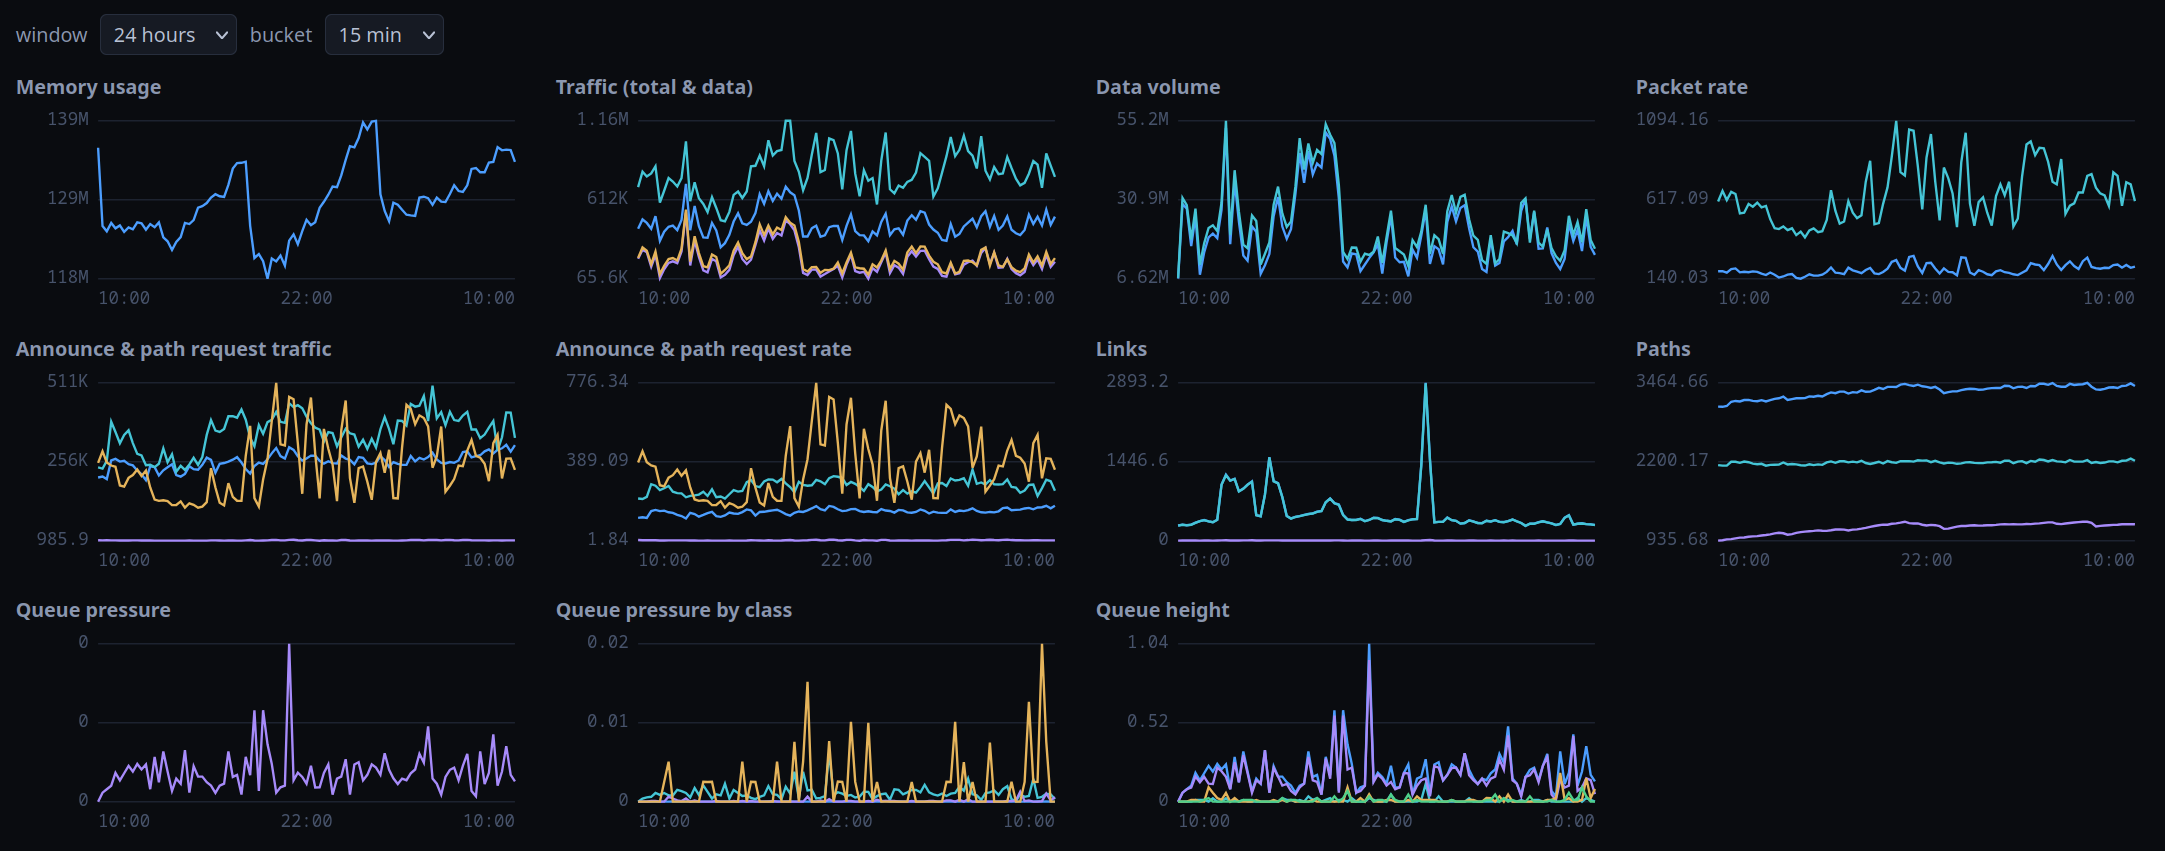
For example, this is Bern, over the last 24 hours. Transport uptime is ~39 hours on the RNS 1.6.0 release version.


bern_1.png


Memory is hovering around 135 MB. It's not that heavily utilized right now, but does have 228 clients connected, and 11 other interfaces (8 of them auto-connects). CPU usage for rnsd is fluctuating at 8-30%, most of that being when announce bursts hit. Stable at 14 threads total (sometimes a few extra on background jobs work, et cetera, but nothing out of the ordinary).


This also has the full network stamp functionality enabled (apart from actual enforcement).


This is running on a real underpowered single-core, 1GB RAM VPS with pretty sad IO, and everything is running smoothly. Even during heavy announce and PR bursts, along with all the normal traffic, I can run voice calls over it with zero drops or stutter.


On all of the other nodes I'm currently monitoring, it's more or less the same picture.

Mark 8dd57a7382268096...
#9

Also, slightly off topic, but notice that 2500+ link spike there; that's a nomadnet scraper. Can't wait to turn on link request stamp enforcement.

Rudi Mentaire 65e0ce50386e9c4e...
#10

Mark answered:


the identity stamps are sort of a bonus feature for now, not really
used actively on normal identities as such, but will probably become
relevant at some point in the future. Where it is used right now is
in the link establishment process. Since every link request is
created from a new, ephemeral identity (to keep the link initiator
anonymous), this is an obvious and elegant place to put the stamp,
since there's zero extra packet overhead, and the destination can
easily verify the stamp value of the link request; it's embedded in
the link request identity!


Thanks for telling the background. Not unclever, yes ;-)

K8 8e4525cda4482720...
edited #11

Mark wrote:

Hmm, that's quite interesting @K8. Something fishy is going on there. Some questions off the top of my head to see if we can try and get to the bottom of it:

  • Is it using plain, vanilla RNS 1.6.0, or do you have any custom patches?
  • Is the profiler or custom logging active?
  • What kind of interfaces is it running? Actually, could you maybe send me the config file, so I can see exactly how it's set up?
  • If you want to, send me an rngit client identity for allowing, and I can give you access to some monitoring tools I'm working on, might make it easier to see what's going on if things are logged over time.

There's definitely something weird happening there, and I'd love to know what it is, since on all the nodes I've tested this on so far, nothing of the sort happens.


Oh fucking hell, I get to be the fool today. I've been working on rebuilding and publishing my deployment scripts and I let the node's RNS config get out of sync. Last time around dealing with this issue, the thing that ultimately seemed to make the most difference was forcing the bitrate of my listener interfaces down to ~30Mbps, low enough to drop the link MTU for connected clients. Combined with the other optimizations you worked on, the node had been up and stable for a full month with no issues. Aaaaand that's the configuration that I accidentally blew away when I deployed 1.6.0... oops. I'm not sure why that would cause all these issues, but seeing the high memory and CPU crop back up as soon as the listener interface bitrate was set higher again (200Mbps, with a proportionally smaller announce_cap) is interesting. The only other changes from bad config -> good config are ic_pr_burst_freq_new = 1 -> 3 and ic_pr_burst_freq = 3 -> 8, plus more generous fast flapping limits in the good config.


For posterity:


  • It's running a few logging patches, yes, plus the aforementioned discovery stamp persistence. I can back it all out and run vanilla, though the only patch that I could see plausibly being involved in this issue is moving logging to it's own thread... and I wrote that one as a potential response to this issue in the first place.
  • I removed all the profilers when I deployed 1.6.0.
  • I sent you a DM.
Mitch 8063324e60eac60b...
#12

Hi Mark, same thing here, and it matches what K8 found. Busy public transport node: RNS 1.6.0, two BackboneInterface listeners with about 600 clients in total, 2 cores, listener bitrate 50M. Every 1-2 hours hundreds of clients were dropped together with "No egress control drain progress for 12s", then the mass reconnect caused more drops. A single __job epoll thread does everything, accept, recv, inline ed25519/x25519 announce validation and the EC drain, so when it stalls for more than 12s the dead time closes every client with queued data. The bitrate makes it worse in two ways: process_announce_queue (Interface.py:445) and Transport.py:1794 start a new threading.Timer for every announce leaving the queue, per client, with a wait of about 4 ms at 50M, and spawned clients also get a bigger link MTU from optimise_mtu. I saw up to 1900 threads, 1137 of them Timers, with __job starved. Not vanilla: listen(1) to listen(128), DP_EC_DEAD_TIME 12 to 60 (not enough alone), sys.setswitchinterval(0.2) (about 100 threads with it, 1900 without). This morning I set both listeners from 50M to 5M and there have been no mass drops since then, still watching. I can't tell yet whether the Timer rate or the MTU is the real cause, since bitrate changes both. Suggestion: one scheduler thread instead of a Timer per announce, validation moved out of the epoll thread, and a configurable backlog and dead time. On the good side, compared to 1.5.7 CPU and RAM went down a lot thanks to sqlite storage instead of files, that part is perfect. Thanks for RNS!

Mitch 8063324e60eac60b...
#13

Update: the 5M bitrate is not a full fix. After 2 hours there was another mass drop, about 80 clients instead of about 500, exactly while an announce wave pushed the live threads to about 400. So the lower bitrate only spreads out the Timer churn. I think one scheduler thread for the announce queues, instead of a Timer per announce, is the real fix.

Mark 8dd57a7382268096...
#14

A single job epoll thread does everything


That is the whole point of using epoll.


when it stalls for more than 12s


If the job itself is stalling for more than a few milliseconds, that is the problem. It should not stall, period. Something else is completely wrong there.


listen(1) to listen(128)


If you can't keep up with connection accepts, allowing a backlog of 128 is not going to fix the problem, it will make it worse. There's a reason it's 1.


DP_EC_DEAD_TIME 12 to 60


You're massively excaggerating your memory exposure, making your problem much worse.


Those "fixes" basically amount to shooting yourself in the foot.


whether the Timer rate or the MTU is the real cause


None of those are the "real cause", fiddling with those parameters should not change anything fundamental in this context.


All in all, it looks like announces are allowed into your instance at a much higher rate than it can keep up with. A stop-gap solution would be to ensure ingress limiting settings, fast-flap blocking, et cetera are reasonable. Many nodes are getting massively spam attacked at the moment, and if you relax the default settings, you're gonna feel it ;)


A lot of that will get wiped out once network stamps are enforced.


While the timer thing is somewhat on point, there's other things collapsing in your case, and I'm looking into it more precisely to figure out what is actually going on, fully.

Mark 8dd57a7382268096...
#15

Also, 100 threads is still insane. A node like your should have ~25 or so max.

Mark 8dd57a7382268096...
#16

By the way @K8 and @Mitch, try and use these fast-flapping block settings on your listeners, and see if that improves things considerably:


    block_fast_flapping = yes
    fast_flapping_block_time = 4320
    fast_flapping_threshold = 18
    fast_flapping_grace = 1


If so, it's most likely caused by the node not being able to keep up with announce dump attacks.

Mitch 8063324e60eac60b...
#17

Thanks Mark, fair points. Update from my side: I replaced the per-announce Timers with a single scheduler thread (local import hook, no RNS files touched) and since then the node runs at 12-15 threads instead of 100-400, with far fewer mass drops. Note: the 100 threads I mentioned earlier was the whole VPS in htop, not rnsd. rnsd alone is at 12 threads right now, in line with what you expect. You are right that something else is going on though: at 13:50-13:54 UTC today rnsd sat at about 105% CPU with threads still low and the job thread mostly idle, and every link stalled for about 4 minutes. Still hunting that one. I have now reverted listen() to 1 and applied your exact fast flapping settings on both listeners. First result: right after the restart, 66 distinct IPs got blocked within 2 minutes (14:51:32 to 14:53:47 UTC), then nothing more. With grace 1 the reconnect wave after a restart is enough to ban about 10% of the clients for 3 days, since any teardown under 18 s counts, whoever closes it. Will watch whether new blocks show up in normal operation. One more thing that looks like a real bug in 1.6.0: when the remote side closes an initiator BackboneClientInterface, reconnect() (BackboneInterface.py:1007) never calls _dp_ec_reset(), so the old queue and _dp_ec_last_drain survive and the EC tears down the new connection about 1 second after "Reconnected". Calling _dp_ec_reset() before reconnecting fixed it here.

Mark 8dd57a7382268096...
#18

Yeah, so just a short note here, but most of this is likely due to what's happening at the moment.


Massive attack going on right now. I have over 800 connections on Bern right now, ~550 of them doing nothing else than dumping crap at full tilt.


Most likely what you're being hit by as well @K8 and @Mitch.


So right now, I'm just taking the opportunity to use it as free load testing. I'll answer the other stuff later.

K8 a361065d039738f6...
#19

Ironically, today my node is doing totally fine. Got a few IPs with 40+ connections each that I'll probably ban, but so far it has managed to avoid the dreaded threaded spiral of doom.

K8 8e4525cda4482720...
#20

Hahaha I've summoned a SYN flood attack with my post. Time to tweak some firewall rules...

Post a Reply

Supports Markdown: **bold**, *italic*, `code`, ```code blocks```, [links](url)

Log in to upload images

Quote
Copied to clipboard