RNS 1.5.0 Testing - Traffic Prioritization & Stability Improvements
PinnedStarted by Mark bc7291552be7a58f... ·
The latest source version of RNS on Aleph has completely reworked inbound traffic processing in the Transport core. By default, RNS now uses four different prioritization levels of packets, which very effectively alleviates increased latency for actual traffic under the insane levels of PR/announces DoS attempts going on lately.
Bad traffic from ingress-limited interfaces are now placed in a low-priority queue, which only drains once higher-priority traffic is done. There's much more detail in the source itself, if you want to have a look, but I'll keep it short here. There's also a long list of various bugfixes.
I'd appreciate any help testing this out before release, it's a pretty big restructuring of how inbound traffic works, so would be good to give it a bit of a spin first.
Also, what the actual ?!? is up with these insane levels of PR/announce spam going on? For example, on one node right now, I'm seeing ~30 clients just connecting and dumping nothing but path requests at around 75 per second. Then there's all the DoS attempts from TOR exit nodes, attempting more or less the same, but mostly just connecting for a few seconds, dumping a couple thousand PRs or announces, and then disconnecting again. I'm not sure if whoever wrote that script missed the fact that they're getting silently blocked. But shhh, don't tell them :P Let em keep playing around, it's great for testing stuff out.
Some of this definitely seems to come from malicious intent, but some of it is also just so weird, that I'm wondering how much of it is just completely broken implementations running wild and doing crazy stuff.
I haven't looked at any of the new matmul-generated "implementations" lately, but I'm wondering if any of them actual have any sort of filtering, de-duplication of announces/PRs, rate-limiting, et cetera, et cetera, or if they're partly responsible for this mess by just passing whatever is handed to them happily to the entire network.

Also, this lays the groundwork for fully customizable traffic prioritization and QoS functionality, so certain traffic can go to a real-time queue, and so on. That won't be in the next release though, let's get the foundations well tested and optimized first.
DoS? Who sees rns as the enemy?
Updated my main nodes. Things seem stable. Watchin the queue pressure meow.
This looks great, awesome work! I'll do what I can to test this out. I have been having a hell of a time keeping rns.kin.earth stable recently, even with very aggressive ingress limiting for announces and PRs (and egress limiting to not pass any bullshit downstream). It's not like it's been particularly stable to begin with so I'm inclined to just throw this release up there and see how it goes.
The node does ok for a while (maybe for a few days to a week) but then I start seeing RNS peg a core to 100% and hang (unrelated to discovery stamps). Packets stop making it through, links have issues establishing, and even rnstatus can hang for 10-60s at times. I really have no idea the root cause at this point. I just restart RNS when things start having issues and it works ok for a few more days. The behavior kind of pattern matches to getting stuck spending too much time in garbage collection but I haven't verified (I was going to experiment by having Transport._jobs() run garbage collection less frequently instead of every 0.25s, or maybe having it decide when to GC based on the fraction of the period that _jobs() actually spent doing work or something like that). This is all on a 4-core VPS with 8GB RAM and fast network.
I think part of it is possibly that I have a high stamp value, which puts me at or near the top of the list for auto-connection. A result of that, as far as I can tell, is that a ton of transport nodes out there auto-connect to my node. One of the patterns I've observed is the node getting pummeled by duplicate path requests (sometimes 50+) all at once, whenever a path request happens on the network. Filtering dupes is normal behavior but the extent of it was pretty extreme, and points to the node being over-connected (aka a nexus of bullshit 😂).
Inbound/outbound queues with prioritization should help a lot. I'm working on collecting more in-depth statistics from the instance to see if I can spot any other patterns.
Edit: looking good so far.
@K8: Sharing the same issue with 1.4.2. After a while, the service stop working.
Here's the last one:
aoû 18 07:15:06 apollo systemd[1]: rnsd.service: Main process exited, code=exited, status=255/EXCEPTION
aoû 18 07:15:06 apollo systemd[1]: rnsd.service: Failed with result 'exit-code'.
aoû 18 07:15:06 apollo systemd[1]: rnsd.service: Consumed 3min 14.919s CPU time over 11min 36.317s wall clock time, 223.4M memory peak, 69M read from disk, 28.8M written to disk, 29.3M incoming IP traffic, 28.2M outgoing IP traffic.
I won't be able to test 1.5.0 sadly, but I hope it will fix this.
Mark wrote:
I haven't looked at any of the new
matmul-generated "implementations" lately, but I'm wondering if any of them actual have any sort of filtering, de-duplication of announces/PRs, rate-limiting, et cetera, et cetera, or if they're partly responsible for this mess by just passing whatever is handed to them happily to the entire network.

So, I checked. Since reticulum-js is currently leaf node only (no transport capability), we're not retransmitting announces or path requests.
However, since we probably want to have transport: true in the future, I'll try to make sure we handle these things as close to Python as is reasonable (given difference in event model, programming language, etc).
De-duplication of announces is already in place, and the max announce rate allowed is once per minute (30min default, though this is JS and such limits can be overridden). What's missing is at least rate limiting. I'll also see what we can do to ensure JS apps can't accidentally spam path requests etc.
Pushed some more tweaks for this. Queue sizes are now configurable with:
[reticulum]
qlen_in_data = 4096
qlen_in_announce = 256
qlen_in_pr = 256
qlen_in_il = 128
Also tuned the defaults, the previous one were unnecessarily large. You can most likely drop the IL queue even further, running it at 48 pkts right now, and seems to be a good spot for my particular node.
I've been running on 503bd6c8 for about 10 hours. Right now I have around 200 clients, and I'm having a hard time actually using the node. Can't even browse Nomad sites that are hosted on the same machine. Queue stats:
Totals : ↑3.45 GB 201.76 Kbps
↓3.14 GB 293.58 Kbps
Qu. Pressure : 0.4% total, 19 pkts, 12341 dropped
0.0% data, 0 pkts
0.0% announce, 9 pkts, 1386 dropped
0.0% path request, 1 pkts
7.0% ingress limiter, 9 pkts, 10955 dropped
The dropped counts don't seem to be raising particularly quickly right now. Node has the same symptoms I described above with constant high CPU usage by RNS on one core, and rnstatus is back to taking ~20s to print anything, so the queues don't seem to be helping with whatever is causing all that. Logs are completely full of path requests as usual.
Have you noticed anything else about the patterns? Like time of day, or the window of time they're connecting for? And are the PRs/announces you're seeing all for the same destination(s), or varied?
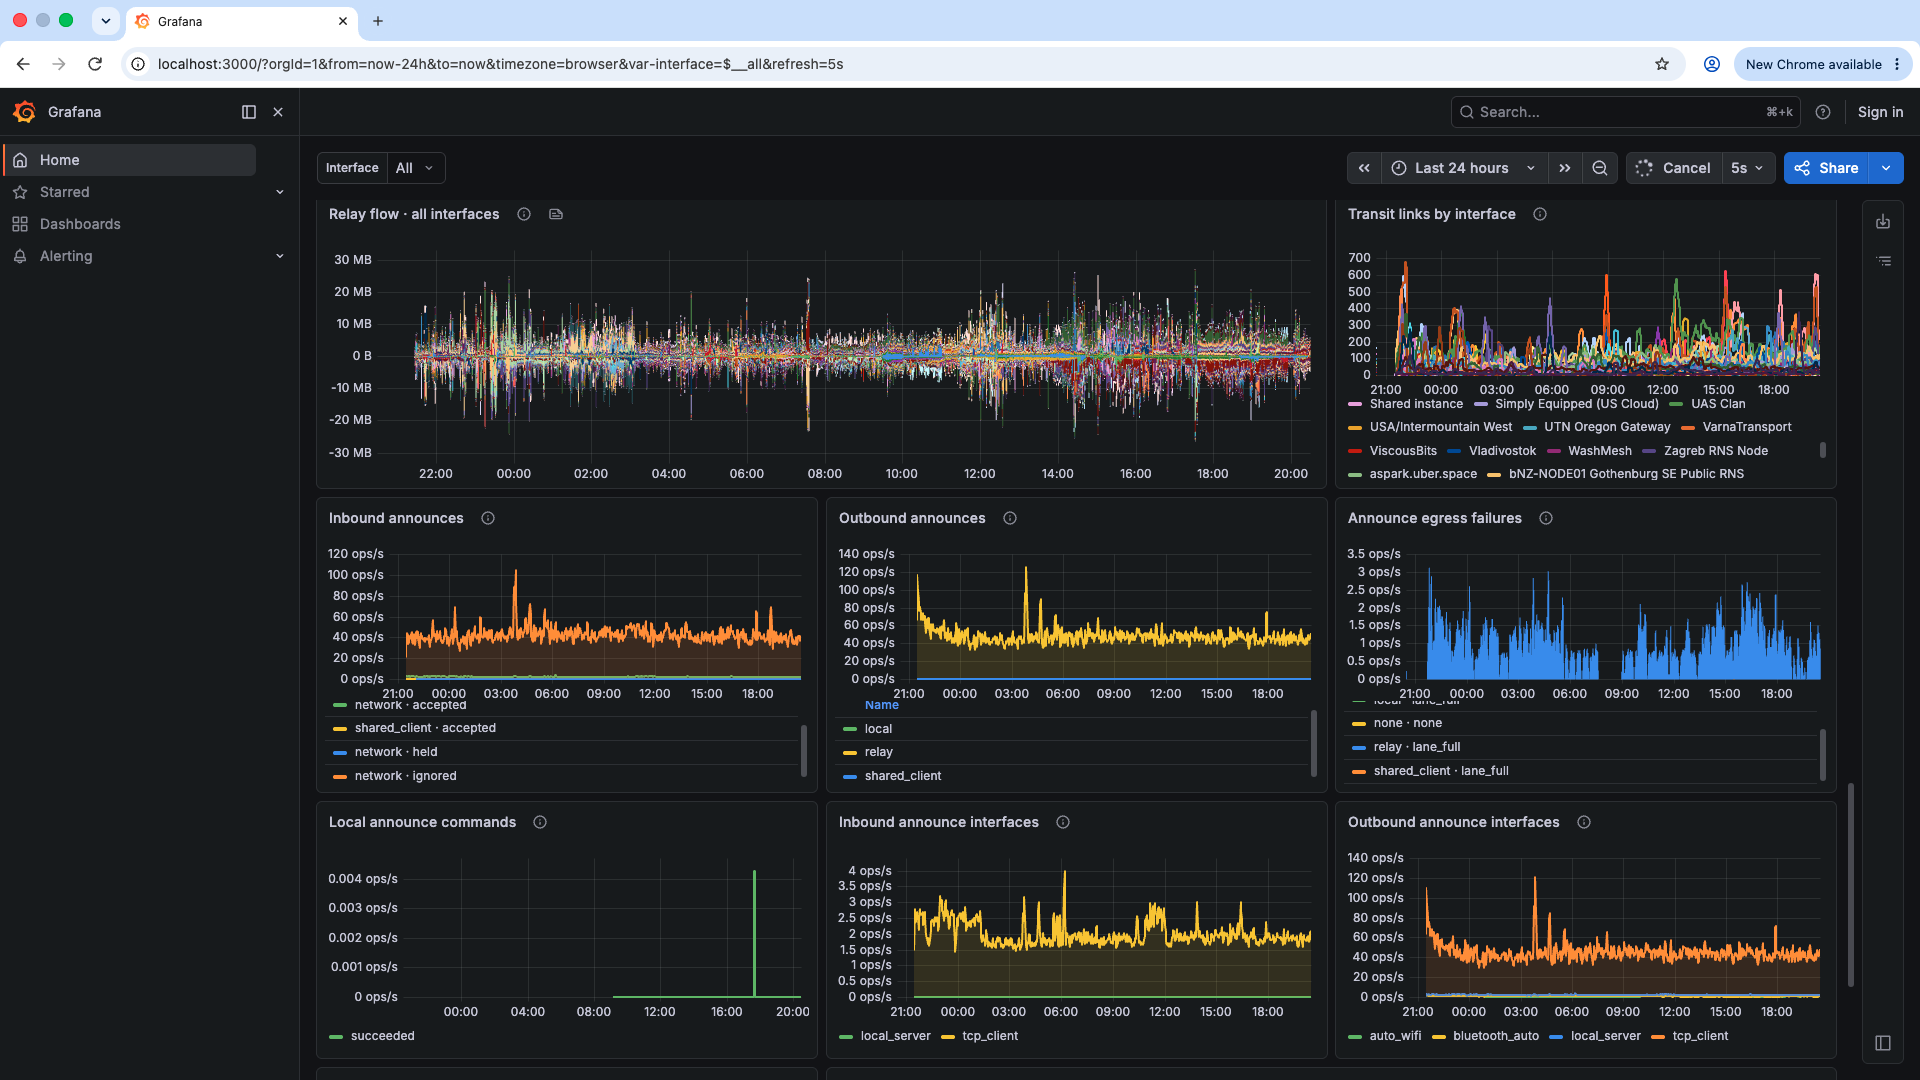
Just asking cuz that might help me dig for specifics. But in the aggregate I haven't seen any sign of that. Currently connected to ~60 public nodes as a transport node to stress test and look for this kind of stuff, and while the data flow fluctuates a lot like you'd expect, and the link counts fluctuate a lot, the inbound announce flow is pretty steady and doesn't show signs of that. Even over a 24 hour period it's mostly a steady flow with a large number of expected-ignored ones

(also just in case anyone's concerned, the seemingly-large number of outbound announces here is just because this is total announces on all interfaces. Each accepted inbound announce from an interface relays out across the rest)
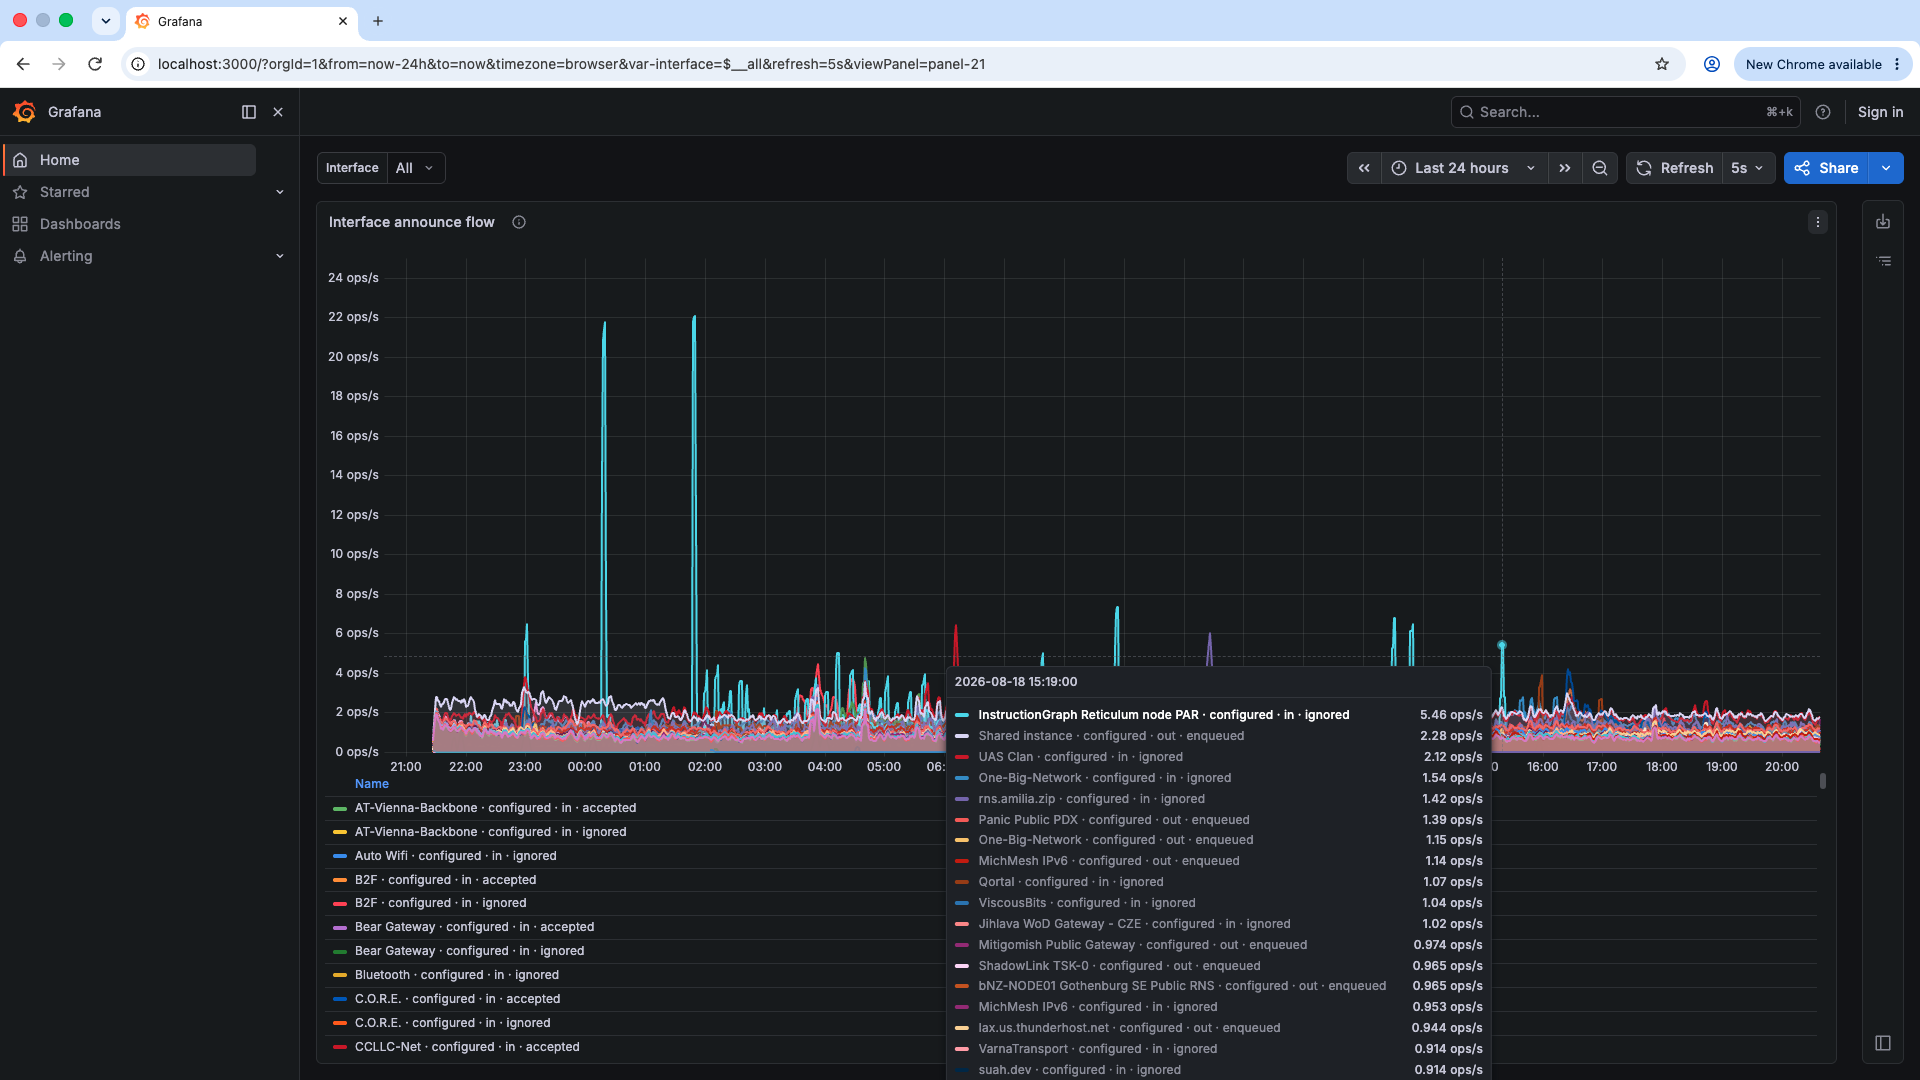
There's one specific interface that had a few spikes compared to the pack, but even then they're extremely brief and only about 20/s during that small window. Doesn't quite seem to fit.

Of course, I can't see what kind of traffic those public nodes are getting directly. And it might be something only happening directly (like your experience, direct connection + immediate spam). But it seems these public nodes are, at least, indeed properly filtering any excess bursts before passing qualified traffic along.